Доклад: Entrepreneurial project Individual Project
At Graph 8 the financial result of the main activity of the “Himgrad” Industrial Park is presented – that is real estate operations, including lease and real estate units buy out.
Graph 8
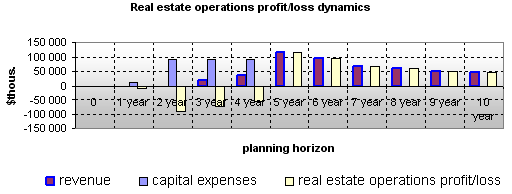
As we see from the graph, the positive financial result in this type of activity appears in the 5th year of project realization, after all the real estate units are put into operation.
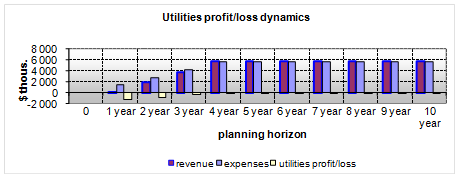
Graph 9 represents the financial result of the utilities providing activity. The financial result here is the minimal positive. This is conditioned by the preferential utilities prices on the industrial park territory. One more circumstance restricting the utilities pricing policy is that this economy sector is controlled by the government and antimonopoly institutions. This type of activity is necessary for the residents, but non-profitable for the company. Nevertheless, low utility prices will provide the site with a greater customers’ inflow. Graph 9
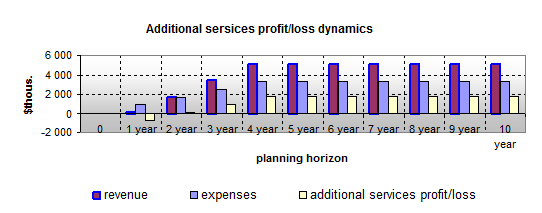
Another profitable type of activity, except the real estate operations, is providing additional services (consulting, law support, marketing, technical permissions etc.). The financial result of this type of activity is presented at Graph 10 .
Graph 10
If we consider the total project earnings structure, it will look as follows (see Graph 11 ).
Graph 11
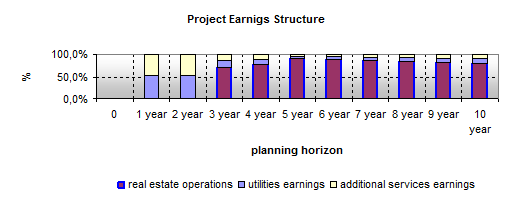
The real estate operations form the bulk of the project earnings, comprising up to 80% of all earnings structure.
7.3. Net Present Value Analysis
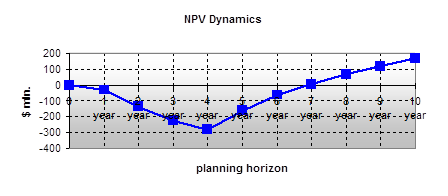
The Project Net Present Value is presented at Graph 12 . According to the Graph, the accumulated project NPV is $167 mln. by the 10th year of project realization. Net profit/sales are expected to be positive by the 7th year of project realization.
Graph 12
7.4. Projected Cash Flow
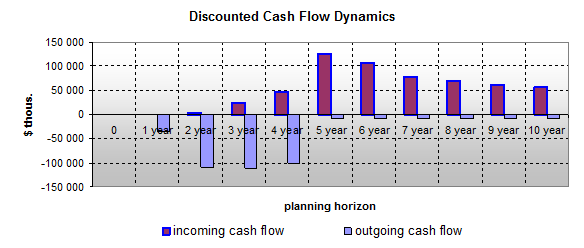
The Project Cash Flow Dynamics is presented at Graph 13 . The positive discounted cash flow in the 5th year of the project realization is conditioned by the total amount of real estate object putting into operation and being leased from that point of time.
Graph 13
7.5. Key Financial Indicators
· Redevelopment site size 131 hectares
· New construction 750 thousand sq.m
o industrial premises 600 thousand sq.m
o office premises 150 thousand sq.m
· Total investment amount $390 mln.
o Front-end investments $15 mln.
o Investment in utilities reconstruction $30 mln.